
WHITEPAPER — PLUNGER LIFT OPTIMIZATION
Your Aged Wells Are Leaving Gas in the Ground. We Can Prove It.
A 90-well Rocky Mountain study shows that complete cycle-level visibility, not polling snapshots, unlocks 13% average production uplift on low-volume plunger lift wells, with 39% gains on stripper wells nearing P&A. Read the full analysis.
KEY FINDINGS
What the Data Shows
High-frequency cycle data, cleansed and joined with setpoint history, unlocked production gains that periodic polling missed entirely. Here are the headline results.
RAW UPLIFT
13%
Production increase
13% production increase across all 90 wells. The median gain of 3.52 mcf/day closely tracks the mean, confirming gains are broad-based — not driven by outliers
INCREMENTAL
32,256
Total mcf Recovered
Cumulative incremental recovery over the post-optimization period. Sensitivity analysis shows 30,100+ mcf even after excluding the top 5 performers.
DURABILITY
1.40
Sustained mcf/day in Latest Weeks
The latest 4 post-optimization weeks show a sustained uplift signal, indicating production gains are durable and not one-time corrections.

METHODOLOGY
How This Study Was Conducted
A rigorous look-back analysis with normalization against 269 control well observations to isolate optimization effects from reservoir and equipment variables.

90-Well Cohort
Legacy wells with tracked baseline 7-day averages, optimization start dates, and weekly post-optimization measurements. Swab/rig activity excluded.

Controller-Logged Cycle Data
Full cycle context — open, arrival, afterflow, shut-in — with setpoint changes and production notes. Not polling snapshots.

Galileo Normalization
Data cleansed, matched (fuzzy threshold 0.80), and normalized with standardized continuous variables for apples-to-apples comparison.

Regression Against Controls
269 control observations. Model controls for Headroom, Drawdown, Off time, Static pressure, Arrival velocity, and Afterflow duration.
WHY CONTROLLER LOGS MATTER
Polling Misses the Full Picture
Polling at 15–60 minute intervals cannot capture transient events within individual lift cycles. Controller logs capture every cycle with timestamps, outcome codes, and setpoint changes — providing the complete context needed for optimization.
REAL-TIME POLLING
Snapshots at fixed intervals. Misses arrival timing, afterflow events, and cycle exceptions. Limited by bandwidth and battery.
CONTROLLER CYCLE LOGS
Complete cycle data — Open → Arrival → Afterflow → Shut-in — with setpoint history and notes. Full diagnostic context.
STRIPPER WELL OPPORTUNITY
Low-Rate Wells Show the Biggest Percentage Gains
39%
Average Uplift on 0–25 mcf/day Wells
Stripper wells (0–25 mcf/day baseline) achieved an 80% positive response rate with +6.73 mcf/day average gain. For wells near economic limits, this incremental production can delay plug-and-abandon decisions by months or years — turning marginal assets into contributors.
DISTRIBUTION ROBUSTNESS
Winsorized mean (P5–P95): 3.56 mcf/day. Excluding top 5 wells still yields 30,100+ mcf incremental. Gains are broad-based, not outlier-driven.
STRIPPER WELL OPPORTUNITY
Low-Rate Wells Show the Biggest Percentage Gains
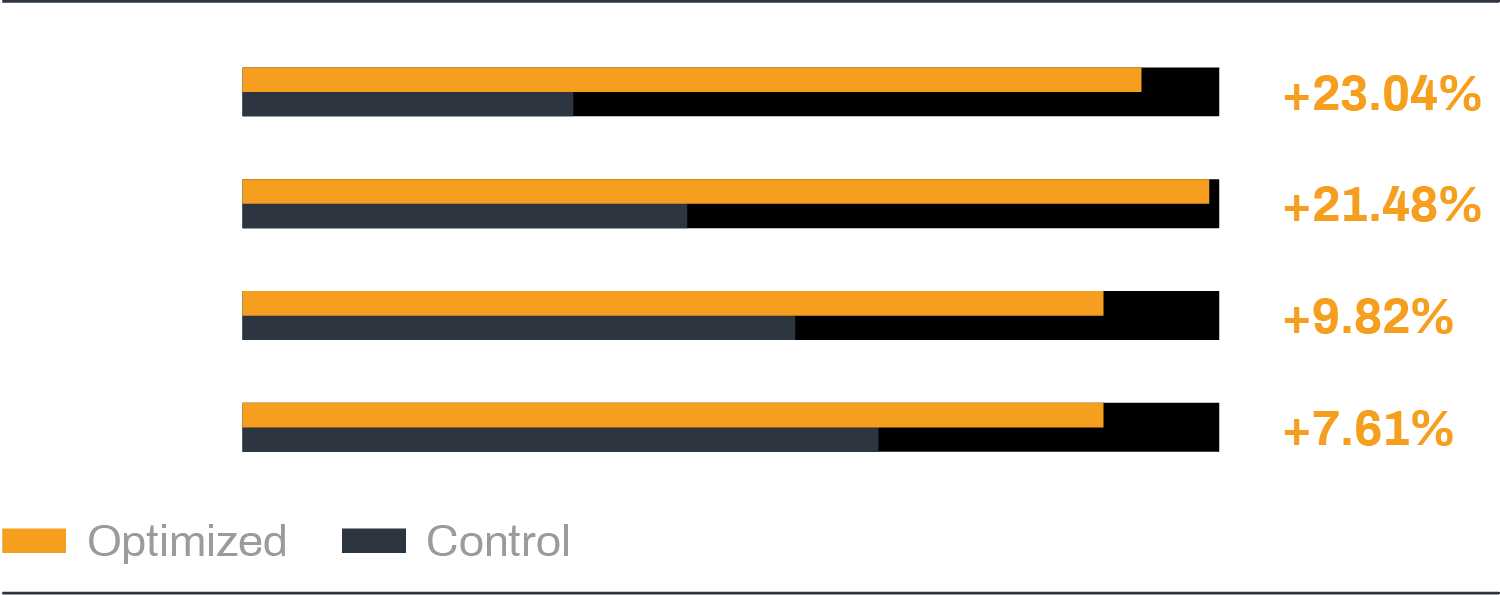
When Headroom, Drawdown, Off time, Static pressure, Arrival velocity, and Afterflow are held equal, optimized wells show a statistically significant production advantage.
Regression Results
The normalized model confirms optimization drives measurable improvement beyond reservoir and equipment characteristics.
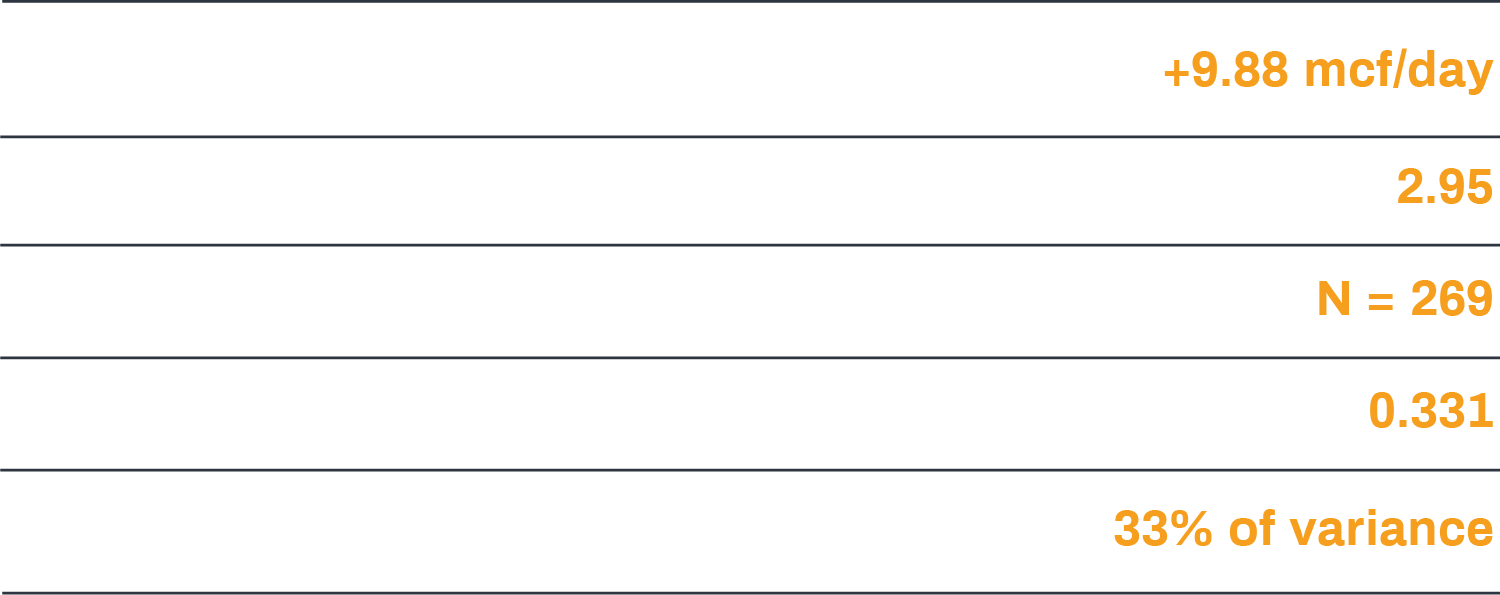
Remaining variance attributed to unmeasured factors (reservoir heterogeneity). Modest R² is common in complex field data and does not diminish optimization significance.
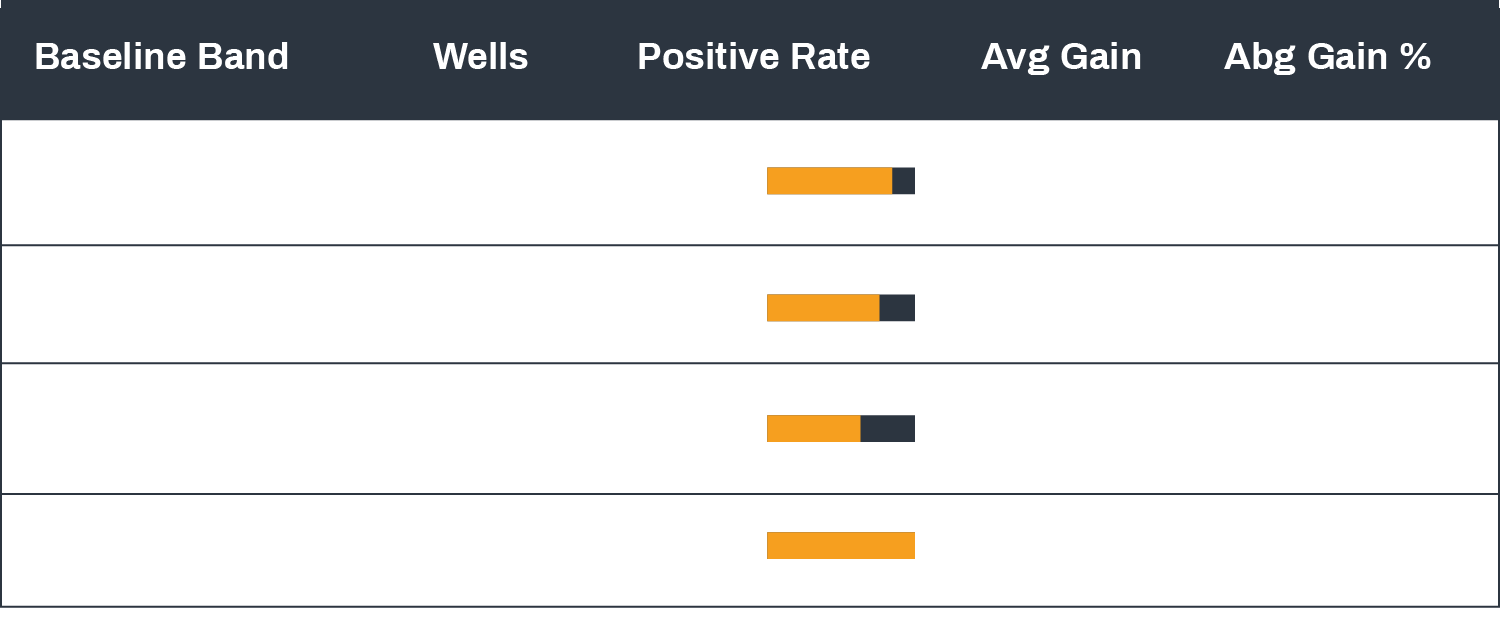
Static Pressure Strata Check
Optimized wells outproduce controls in every pressure band. Lower pressure wells benefit most — consistent with cycle timing becoming critical as reservoir energy declines.
Values = mcf/day difference. Lower pressure wells show greatest optimization benefit.
Get the Full Study
Access the complete analysis including methodology details, gain distributions, normalization regression, and stripper well economics.